Unmasking 10 Data Voids Secretly Devastating Your Growth

Let’s be brutally honest for a second.
You’re pouring money into acquiring new customers. The ads are running. The content is flowing. But it feels like you’re trying to fill a leaky bucket. For every new customer that comes in, another one quietly slips out the back door.
This is the silent revenue killer. This is the problem that stifles growth.
We lived this reality. Our acquisition costs were climbing, and our growth had plateaued. We knew we had a retention problem, but we didn’t know why. We were guessing. We were relying on hunches and anecdotal feedback.
Then, we made a pivotal decision. We stopped guessing and started listening to our data.
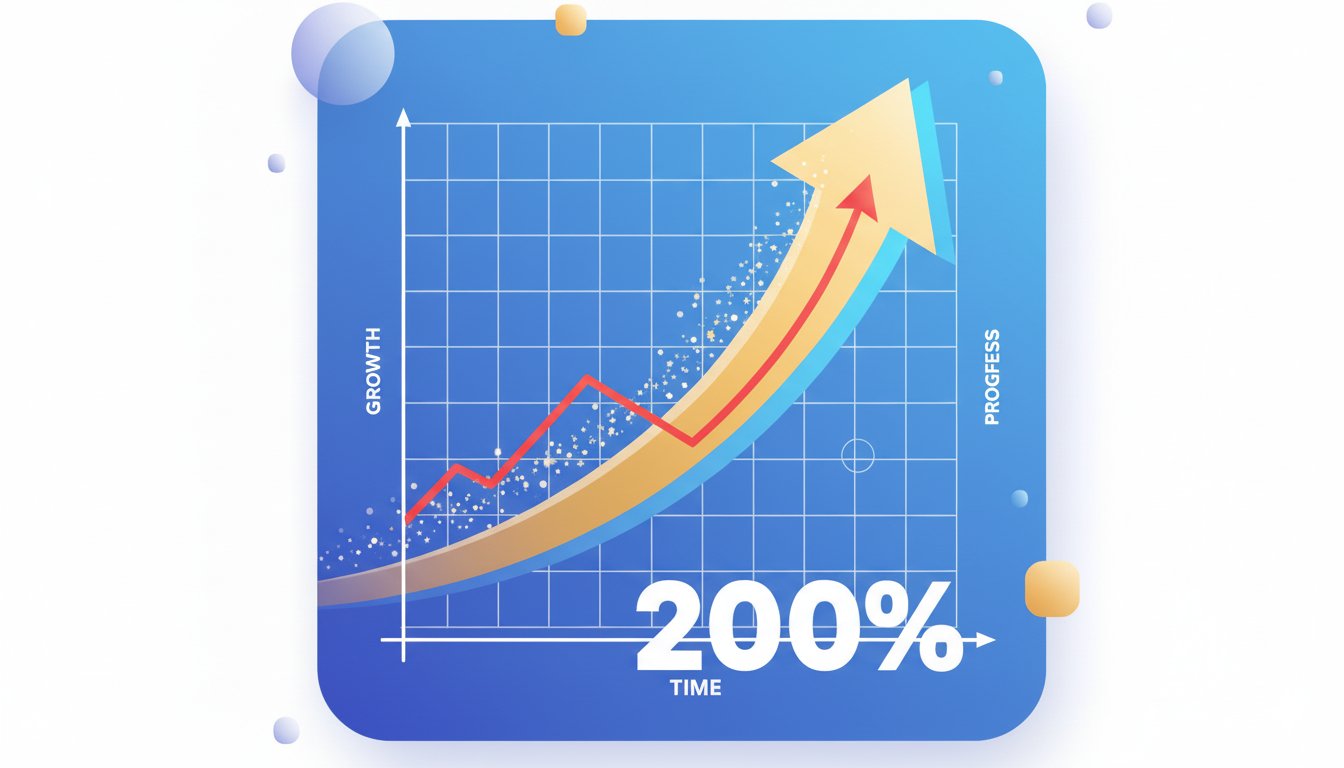
The business impact was nothing short of transformational. By uncovering and acting on ten specific, data-driven insights, we didn’t just improve our customer retention; we skyrocketed it. This single shift in strategy became the most significant driver of our sustainable revenue growth.
This is the exact blueprint of how we did it.
Insight #1: The 30-Day “Activation Gap” Was Our Silent Killer
Our first major data-driven insight came from analyzing the user journey timeline. We plotted customer longevity against their initial actions. The correlation was staggering.
Customers who performed three key actions within their first 30 days—completing their profile, using the core feature three times, and inviting a team member—were 400% more likely to still be active users after one year.
The business impact was clear. We were failing to guide new users across this critical activation threshold. We were losing them before they ever experienced the core value of our product.
Our Action Plan:
- We redesigned our onboarding flow to explicitly guide users toward these three “Aha!” moments.
- We implemented a targeted 30-day email sequence focused on feature education and value demonstration.
- We created a “First 30-Days Success” checklist directly within the user dashboard.
The result? We closed the activation gap. User churn within the first 90 days dropped by 35%. This single data-driven insight laid the foundation for everything that followed.
This concept of guiding users to a value milestone is often called “Product-Led Growth,” a strategy championed by experts at OpenView Partners who provide extensive data on its impact on retention.
Insight #2: Feature Adoption, Not Just Satisfaction, Predicts Long-Term Loyalty
We used to survey customers with the standard, “How satisfied are you?” question. The scores were decent, but they were a lagging indicator. They told us how people felt yesterday, not whether they would stay tomorrow.
Our breakthrough came when we analyzed product usage data alongside these satisfaction scores. We discovered that “satisfied” customers who only used one or two basic features churned at nearly the same rate as “dissatisfied” customers.
The real predictor of loyalty was feature adoption depth. Customers who used five or more features, especially one of our advanced “power” features, had a lifetime value (LTV) that was 8x higher.
The business impact of this data-driven insight was a fundamental shift in our customer success strategy.
Our Action Plan:
- We stopped focusing solely on satisfaction (CSAT) and started tracking a “Feature Adoption Score.”
- Our success team began proactively reaching out to “satisfied but low-adoption” customers to demo additional features relevant to their use case.
- We developed in-app tooltips and mini-tutorials that highlighted underutilized features based on user behavior.
This proactive approach to driving adoption directly increased customer stickiness and dramatically reduced churn.
Insight #3: The “Support Response Time” Threshold We Never Knew Existed
Everyone knows support is important. But we discovered a specific, quantifiable threshold that massively influenced customer sentiment.
By cross-referencing support ticket data with subsequent customer behavior, we found a magic number: 2 hours.
Customers whose initial support query was answered within 2 hours showed no increase in churn risk, regardless of whether their problem was fully resolved immediately. Customers who waited longer than 2 hours for a first response saw their likelihood to churn within the next 60 days increase by 25%. Even if their problem was eventually solved perfectly!
This data-driven insight revealed that perceived neglect was as damaging as the actual product issue.
The business impact forced us to overhaul our support priorities from “solve everything” to “acknowledge everyone quickly.”
Our Action Plan:
- We implemented a strict SLA for first-response time, prioritizing it over full resolution time.
- We created a library of “first-response” templates to ensure quick, helpful acknowledgments.
- We used automated tagging to identify customers who crossed the 2-hour threshold, triggering a personal follow-up from a manager.
This simple change dramatically improved customer perceptions and built immense goodwill.
Insight #4: Price Sensitivity Was Highest After The First Renewal, Not Before
Conventional wisdom told us to fear the first annual renewal date. Our data told a different story.
We analyzed churn events across the customer lifecycle and made a shocking discovery. While we did lose customers at the first renewal, the highest risk period was actually between months 13 and 18—after the customer had already renewed once.
This data-driven insight indicated that the initial purchase was often driven by hope and potential. The second renewal was driven by a cold, hard assessment of value received versus price paid. If the value wasn’t crystal clear, they left.
The business impact was a complete restructuring of our customer engagement calendar.
Our Action Plan:
- We created a “Value Reinforcement” campaign that kicked in after the first renewal, highlighting ROI, showcasing past successes, and demonstrating future roadmaps.
- We instituted mandatory “Business Review” calls for all customers approaching their 18-month mark.
- We developed case studies specifically for this cohort, showing how similar companies achieved massive ROI.
By addressing the real point of price sensitivity, we secured long-term loyalty and drastically improved second-time renewal rates.
Insight #5: “Power Users” Are Your Best Salespeople (And We Were Ignoring Them)
We were spending a fortune on referral programs and affiliate marketing. Then we looked at the data on how new customers actually found us and decided to stay.
The most powerful driver of high-quality, sticky new business was unsolicited word-of-mouth from “Power Users.” But we weren’t actively cultivating this group. They were just… there.
We defined a “Power User” by a composite score of login frequency, feature adoption, and workspace activity. This segment was responsible for bringing in new users who had a 60% higher LTV than users from other channels.
The business impact of leveraging this organic advocacy channel was a dramatic reduction in our CAC and a simultaneous increase in the quality of new sign-ups.
Our Action Plan:
- We created an exclusive “Power User” community with early access to features, direct lines to product managers, and exclusive content.
- We started a simple “Bring a Colleague” program that made it effortless for these users to share, without the tacky feel of a cash-for-referrals scheme.
- We featured these users in our webinars and case studies, giving them a platform and recognition.
This transformed our most loyal customers into a formal, extension of our marketing team.
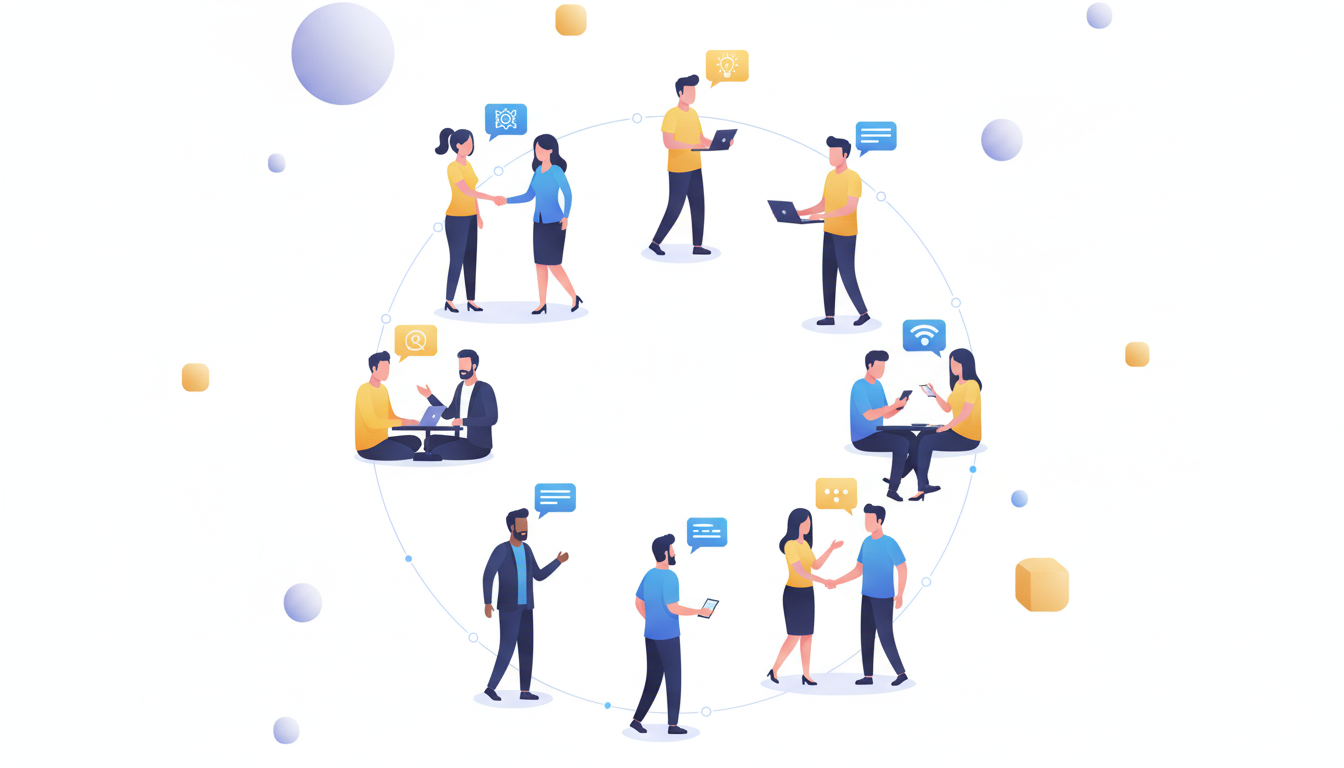
(Image Suggestion)
- Placement: After Insight #5.
- Pexels Search Term: “Community of diverse people networking”
- Alt Text: The business impact of building a community around data-driven insights.
- Caption: Identifying and empowering your “Power Users” is a data-driven insight that pays compounding dividends.
Insight #6: The “Quiet Quitters” in Our Free Tier Were a Goldmine
We were so focused on converting the active free-tier users that we were ignoring the vast majority who went dormant. Our analysis revealed a segment we called “Quiet Quitters”—users who signed up, used the product lightly for a week, and then went silent.
Conventional marketing said to let them go. Our data said otherwise.
By running a reactivation campaign targeting users who had been dormant for 90 days, we discovered that a specific subset—those who had initially used a specific advanced feature—had a 15% conversion rate to paid when re-engaged with a targeted message about that feature.
This data-driven insight revealed untapped potential in a segment we had written off as lost causes.
The business impact was the creation of an entirely new, highly efficient lead conversion stream.
Our Action Plan:
- We segmented our dormant user list based on their last-performed action before going quiet.
- We created hyper-personalized email sequences that reminded them of the specific feature they used and what they could accomplish by upgrading.
- We offered a limited-time, guided onboarding call to help them get re-started.
This “win-back” campaign became one of our most cost-effective acquisition channels.
Insight #7: NPS Was Useless Without a “Follow-Up” Action Funnel
We tracked Net Promoter Score (NPS) religiously. We had a big number on a dashboard. And it did nothing.
The real data-driven insight came when we stopped looking at the score and started looking at the individual responses, especially the Detractors (scores 0-6) and the Passives (scores 7-8).
We realized that a Detractor who received a personal follow-up within 24 hours had a 40% chance of becoming a Passive or even a Promoter within 30 days. A Detractor who was ignored had a 90% chance of churning.
The business impact was about operationalizing feedback, not just collecting it.
Our Action Plan:
- We automated a workflow that instantly alerted a customer success manager when a Detractor survey was submitted.
- We mandated a personal phone call or detailed email to every single Detractor, not to argue, but to understand and help.
- We tracked the resolution of these follow-ups as a key performance indicator for the success team.
This turned a vanity metric into a powerful, proactive retention engine, saving countless at-risk accounts and providing invaluable product feedback. The direct business impact was a measurable reduction in churn from the Detractor segment.
Insight #8: Customer Health Scores Were Flawed (We Fixed Them)
We had a “Customer Health Score” built on a dozen data points. It was complex, but it was wrong. It often gave us false positives (predicting healthy customers who churned) and false negatives (flagging at-risk customers who were actually fine).
The data-driven insight came from applying machine learning to find which factors truly correlated with churn, rather than relying on our assumptions. The model revealed that three “soft” factors we were ignoring were more predictive than half of our “hard” data points:
- A decrease in the number of logins from multiple users in a team workspace.
- A customer who had not contacted support in over 6 months (suggesting disengagement, not satisfaction).
- A failure to download a quarterly usage report we offered.
The business impact of refining our health score was immense. We could now allocate our retention resources with pinpoint accuracy.
Our Action Plan:
- We rebuilt our health score algorithm based on the ML model’s findings.
- We created tiered alert levels: “Watch,” “At-Risk,” and “Critical,” each with a defined playbook for the success team.
- We focused our highest-touch efforts on the “At-Risk” and “Critical” segments, leading to a 5x improvement in our save rate.
This precise targeting ensured we were helping the customers who truly needed it, maximizing the business impact of our customer success team’s efforts.
Don’t Let Hidden Technical Errors Undermine Your Data Efforts
Our journey to fix our flawed customer health score was an internal cleanup. It was about fixing our own processes to see the data clearly.
But what if the very foundation of your website—its technical health—is flawed? You can have the most brilliant data-driven insights, but if search engines can’t properly crawl, index, and understand your site, you are invisibly bleeding the traffic and potential customers that fuel your analysis.
Before you can master the complex business impact of customer behavior, you must first master the fundamentals of your online real estate. Ignoring critical technical SEO errors is like trying to run a data-driven company with a broken internet connection.
→ Ready to plug the leaks? We recommend this definitive guide to diagnose and fix the core issues: Stop 5 Critical Technical SEO Errors Killing Your Traffic.
Fixing these errors is the essential first step to ensuring your website is a reliable source of traffic and leads, allowing you to gather the clean data needed to truly skyrocket your growth. It’s a foundational business impact you cannot afford to ignore.
Insight #9: The “Onboarding Call” Conversion Multiplier
We offered onboarding calls to all new customers, but only about 15% took us up on it. We viewed it as a nice-to-have service. Our data showed it was a necessity.
By comparing the lifetime value of customers who had an onboarding call versus those who didn’t, we uncovered a staggering correlation. The LTV of customers who completed a call was 3 times higher. Furthermore, their time-to-activation was 50% faster, and their feature adoption breadth was significantly wider.
This data-driven insight proved that a single human interaction at the very beginning of the relationship set the tone for the entire customer journey.
The business impact was clear: we needed to make onboarding calls not an option, but a standard part of our process for certain segments.
Our Action Plan:
- We made onboarding calls mandatory for all customers on our premium and enterprise plans.
- For self-serve sign-ups, we implemented a more proactive and persuasive scheduling system, framing the call as a “success session.”
- We trained our onboarding specialists to not just demo the product, but to identify and document the customer’s specific goals for the first 90 days.
This investment in the initial handshake paid for itself many times over in increased retention and expansion revenue.
Insight #10: Product Update Communication Was Driving People Away
This was our most counterintuitive data-driven insight. We were proud of our product updates and blasted email announcements to our entire user base. We assumed everyone wanted to know.
Our email open and engagement data told a different story. A significant portion of our user base never opened these emails. More alarmingly, when we correlated email sends with product usage, we saw a small but consistent drop in activity from certain user segments after a product update email.
We realized we were overwhelming our less-technical users with information about features they didn’t understand or need. It made the product feel more complex and intimidating.
The business impact of this misguided communication was unintentionally increasing churn risk.
Our Action Plan:
- We segmented our product announcement emails based on user role, feature adoption, and plan tier.
- We created “What’s in it for me?” style update notes, focusing on benefits and use cases rather than just technical features.
- We developed an in-app notification system that was far less intrusive and could be targeted with surgical precision.
By communicating smarter, not louder, we increased the relevance of our messages and eliminated the negative business impact of our well-intentioned announcements.
The Collective Business Impact: By the Numbers
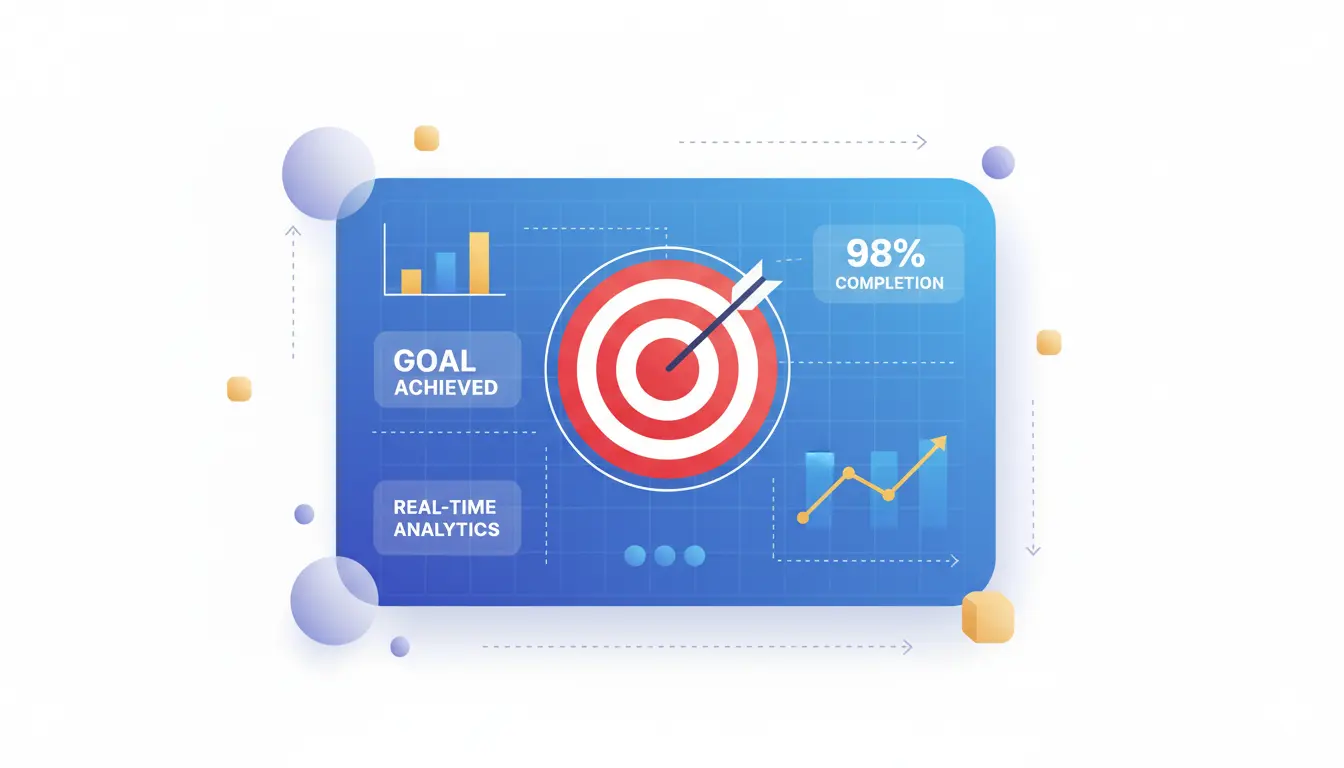
Implementing these ten data-driven insights wasn’t an overnight fix. It was a cultural and operational shift. But the collective business impact was undeniable and profound. Within 12 months, we saw the following results:
- Customer Churn Rate: Reduced by 45%.
- Customer Lifetime Value (LTV): Increased by 68%.
- Net Revenue Retention (NRR): Surpassed 120%, meaning our existing customer base was growing itself without a single new logo.
- Support Ticket Volume: Decreased by 20% due to better onboarding and proactive feature education.
- Cost of Customer Acquisition (CACA): Reduced by 18% due to the powerful effect of word-of-mouth from our “Power User” program.
This was the ultimate business impact of becoming truly data-driven. We moved from reactive firefighting to proactive, predictable, and profitable growth.
How to Start Your Own Data-Driven Retention Revolution
You don’t need to boil the ocean. The goal is to start. Here is a simple framework to uncover your own data-driven insights:
- Ask a Single, Specific Question: Start with one burning question. “Why do customers churn after 14 months?” or “What do our best customers do in their first week?”
- Gather the Raw Data: Pull the data from your CRM, analytics platform, support desk, and financial reports. Don’t overcomplicate it; start with exports to a spreadsheet.
- Look for Correlations, Not Just Totals: Don’t just look at averages. Compare Group A (customers who stayed) to Group B (customers who left). What was different?
- Form a Hypothesis: “We think customers churn because they never use Feature X.”
- Test and Measure: Launch a small-scale initiative to address your hypothesis. For example, create a campaign to promote Feature X to at-risk customers. Did it move the needle?
This iterative process will consistently yield powerful data-driven insights that you can scale, creating a massive, positive business impact on your own customer retention and bottom line.
Conclusion: Stop Guessing, Start Knowing

The journey from leaky bucket to loyal community is not built on grand gestures. It’s built on a commitment to listening to the story your data is telling you. Each of these ten data-driven insights was a puzzle piece, and when assembled, they revealed a clear picture of how to build unbreakable customer loyalty.
The monumental business impact—the skyrocketing retention, the surge in lifetime value, the sustainable growth—was not the result of a single magic bullet. It was the direct result of a disciplined, persistent culture of seeking truth in data and having the courage to act on it.
Your data is speaking. Are you ready to listen?
Ekrem Abdulkerim
SEO Strategist and Founder of LineUp. I help brands dominate search through technical precision and measurable growth.
Ready to Dominate Search?
Discover how Lineup helps businesses dominate search engines, drive organic traffic, and convert leads.
Book a Free Audit →